Driving Sustainability using AI
Developed machine learning models that estimate Scope 1 and Scope 2 greenhouse gas emissions for non-reporting companies using ESG-related financial and operational data provided by Sustainable Fitch
About This Project
This project was developed as part of the Sustainable Fitch Codeathon to address ESG data gaps caused by incomplete emissions reporting. Our team built data-driven pipelines that clean, analyze, and model company-level features such as revenue, region, industry, and ESG indicators to predict Scope 1 and Scope 2 emissions. The project includes extensive exploratory data analysis, feature engineering, and regression modeling, supported by visualizations such as histograms, scatter plots, and correlation heatmaps. Full details and methodology are available on our Devpost submission: https://devpost.com/software/team-3-ku6tey. Lastly this project was created in colaboration with Harini Solaidurairaj, Shreya Patel, and Krisha Patel.
Key Features
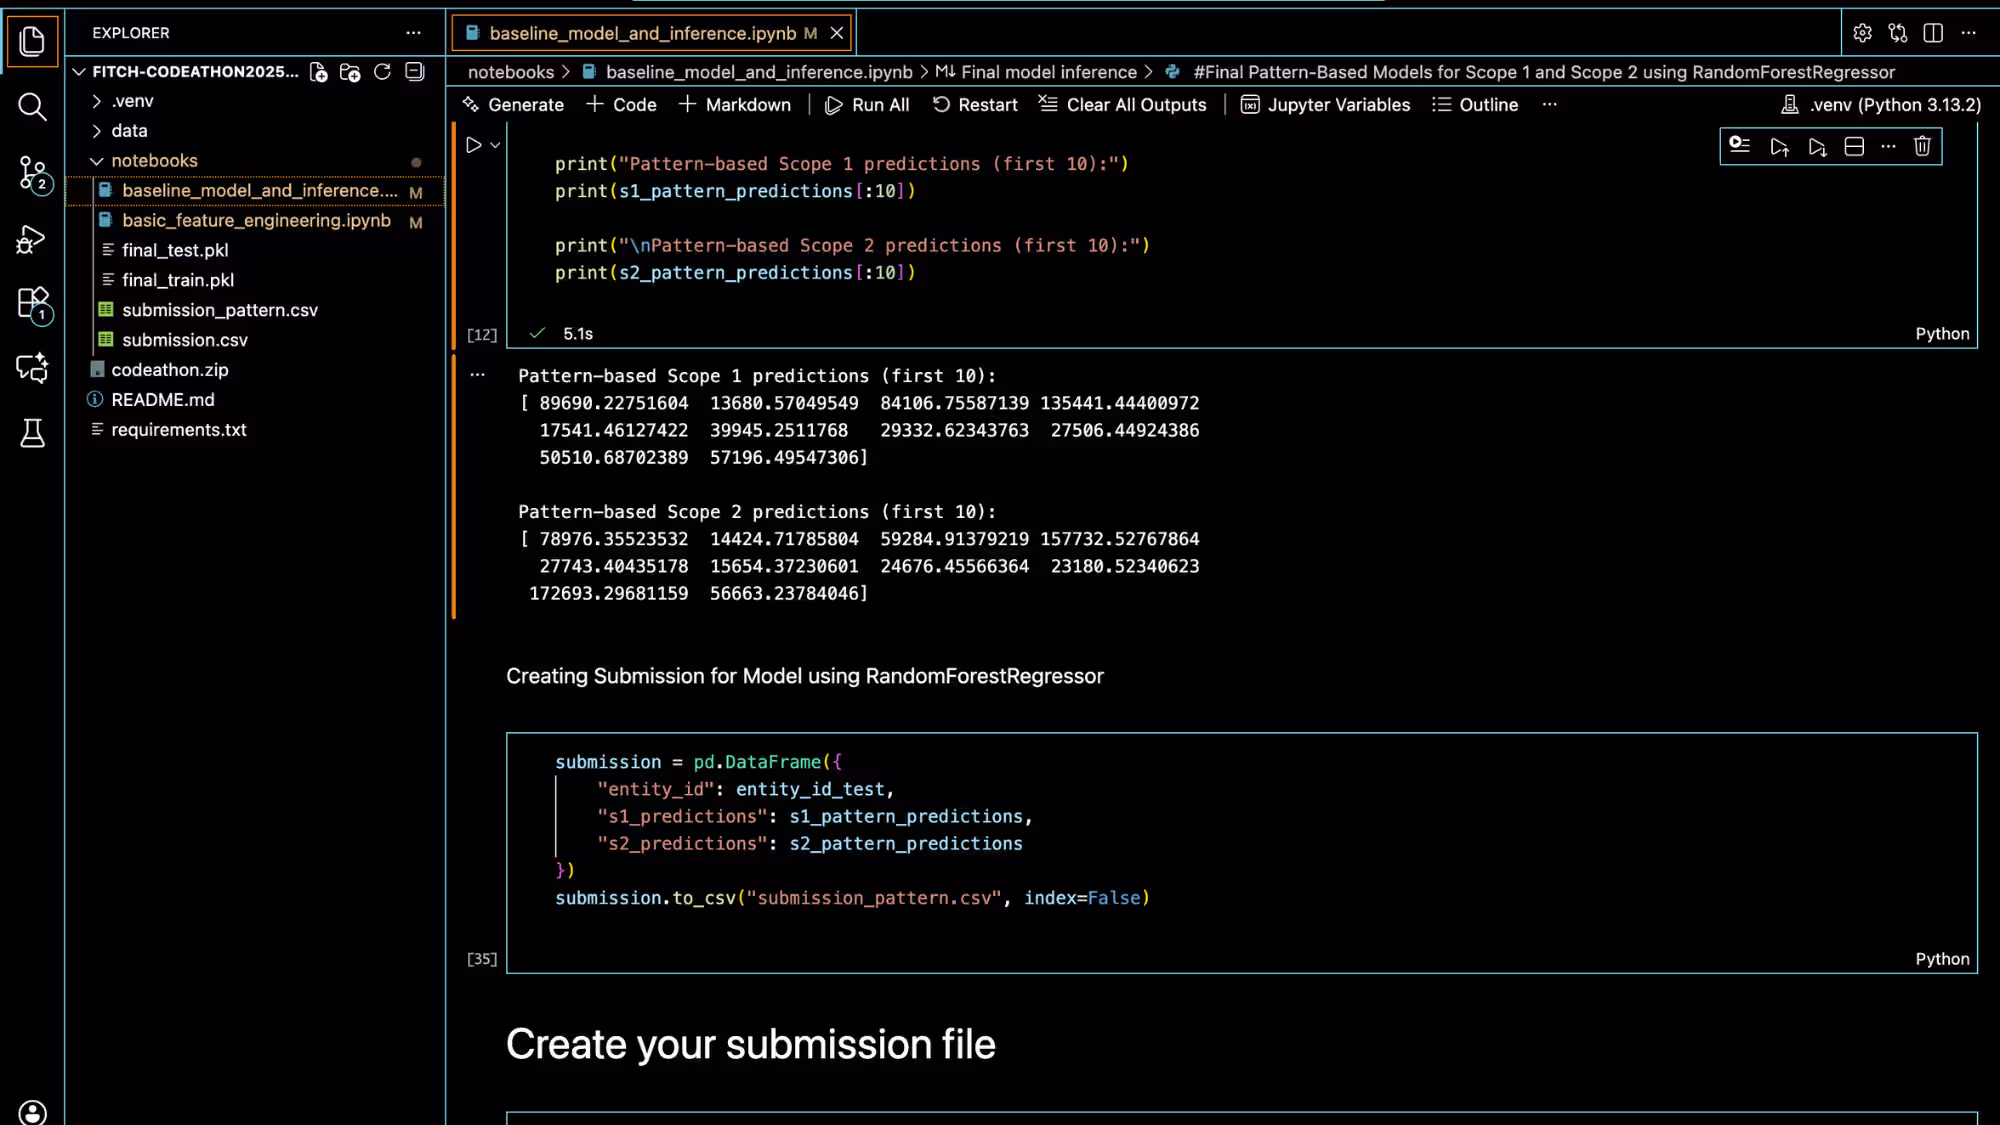
- Scope 1 and Scope 2 emissions prediction for non-reporting companies
- Random Forest regression pipelines for emissions estimation
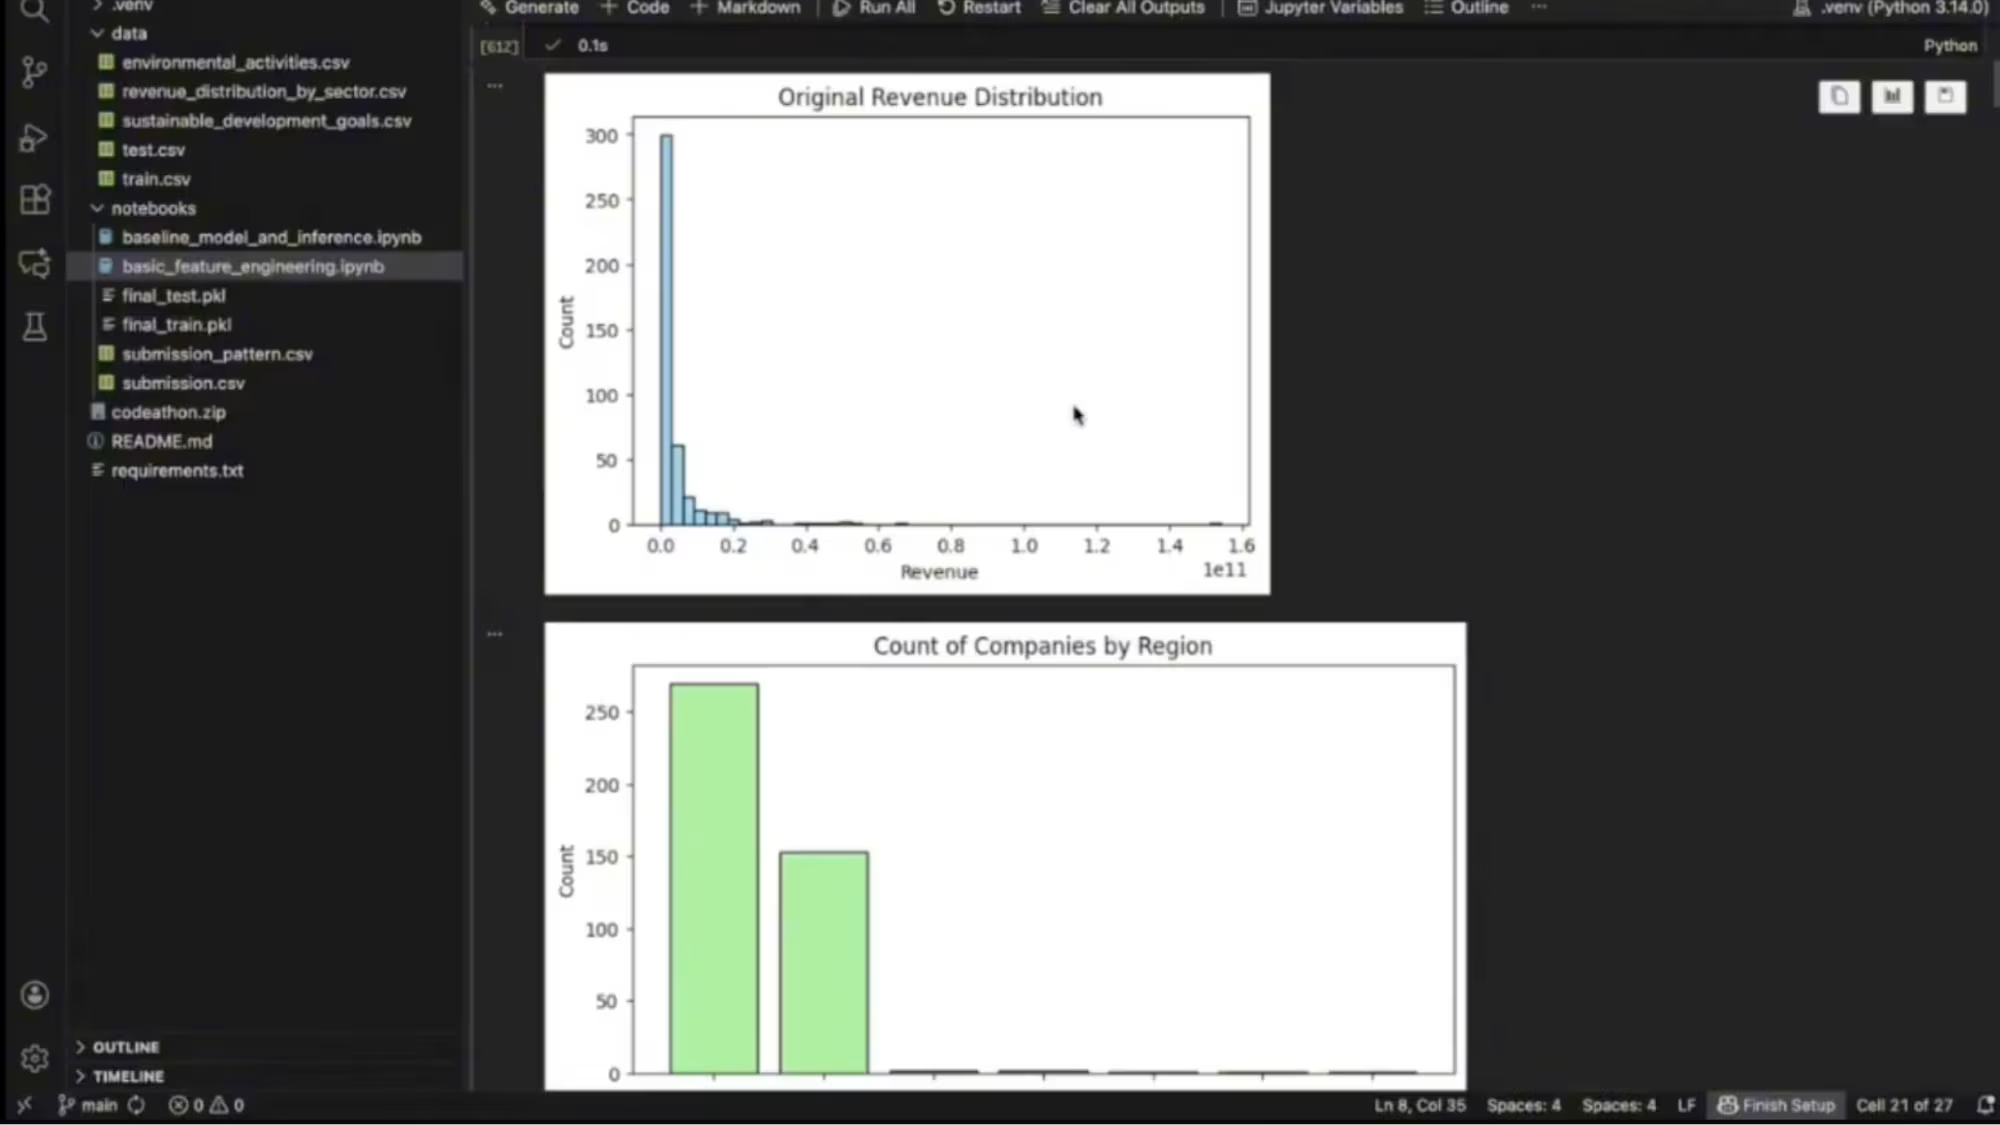
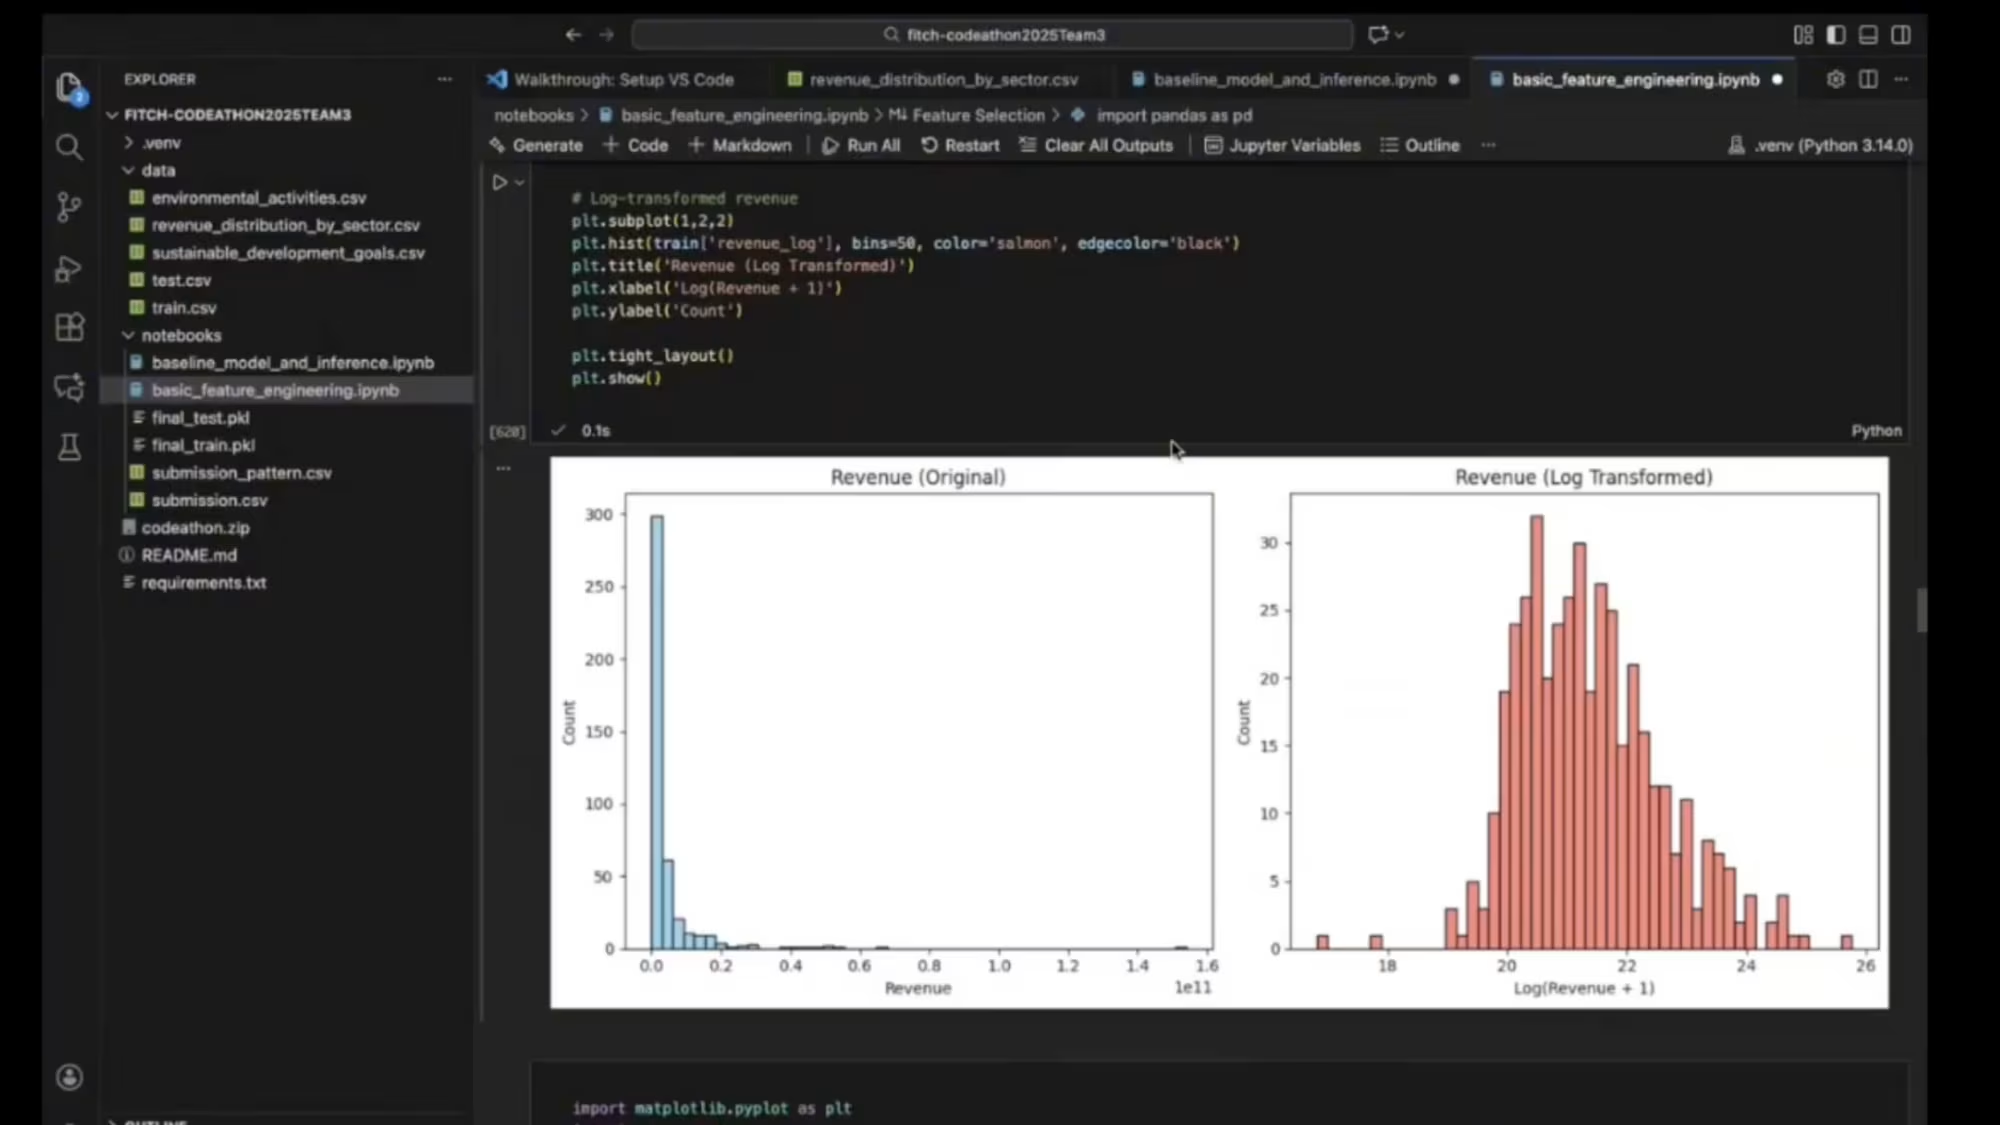
- Log-transformed and engineered financial features to handle skewed data
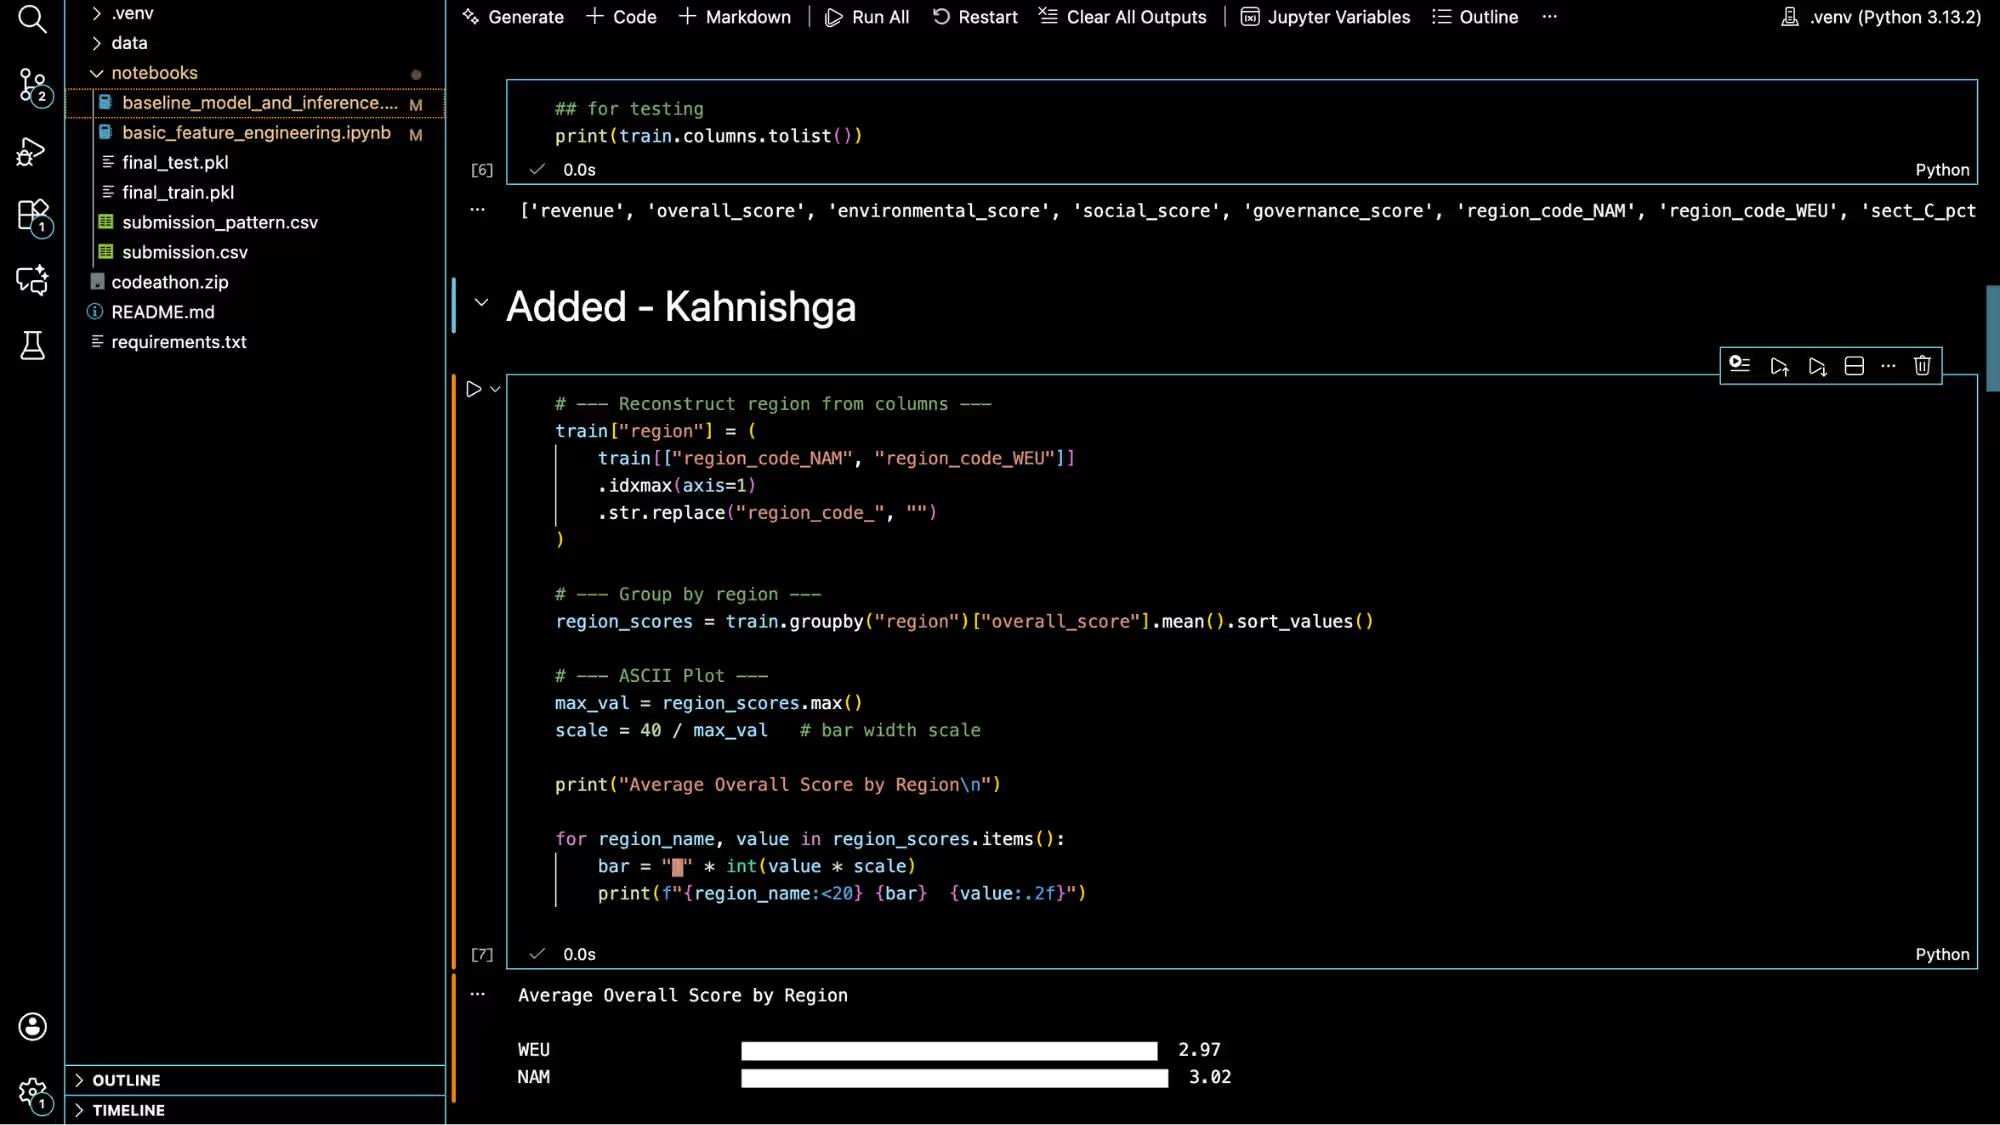
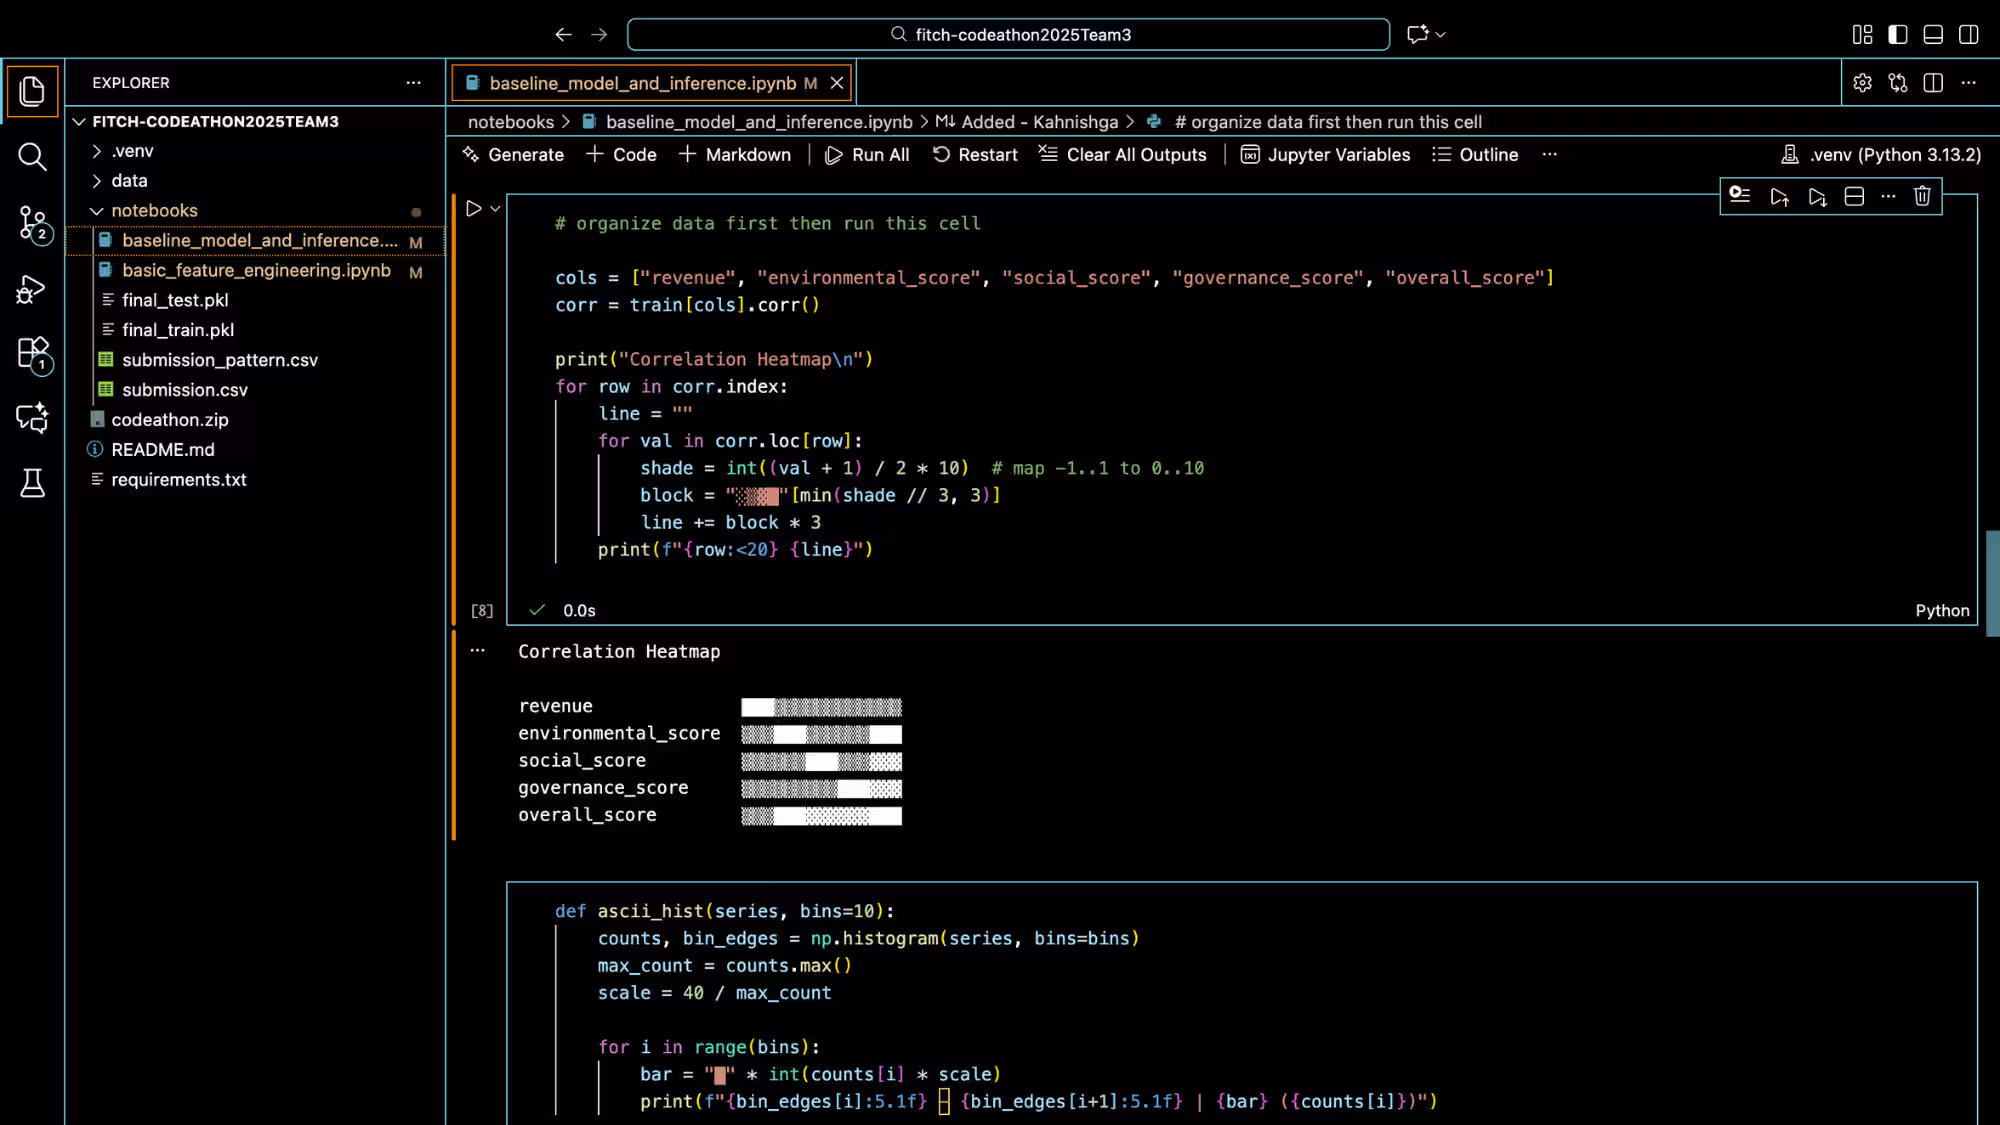
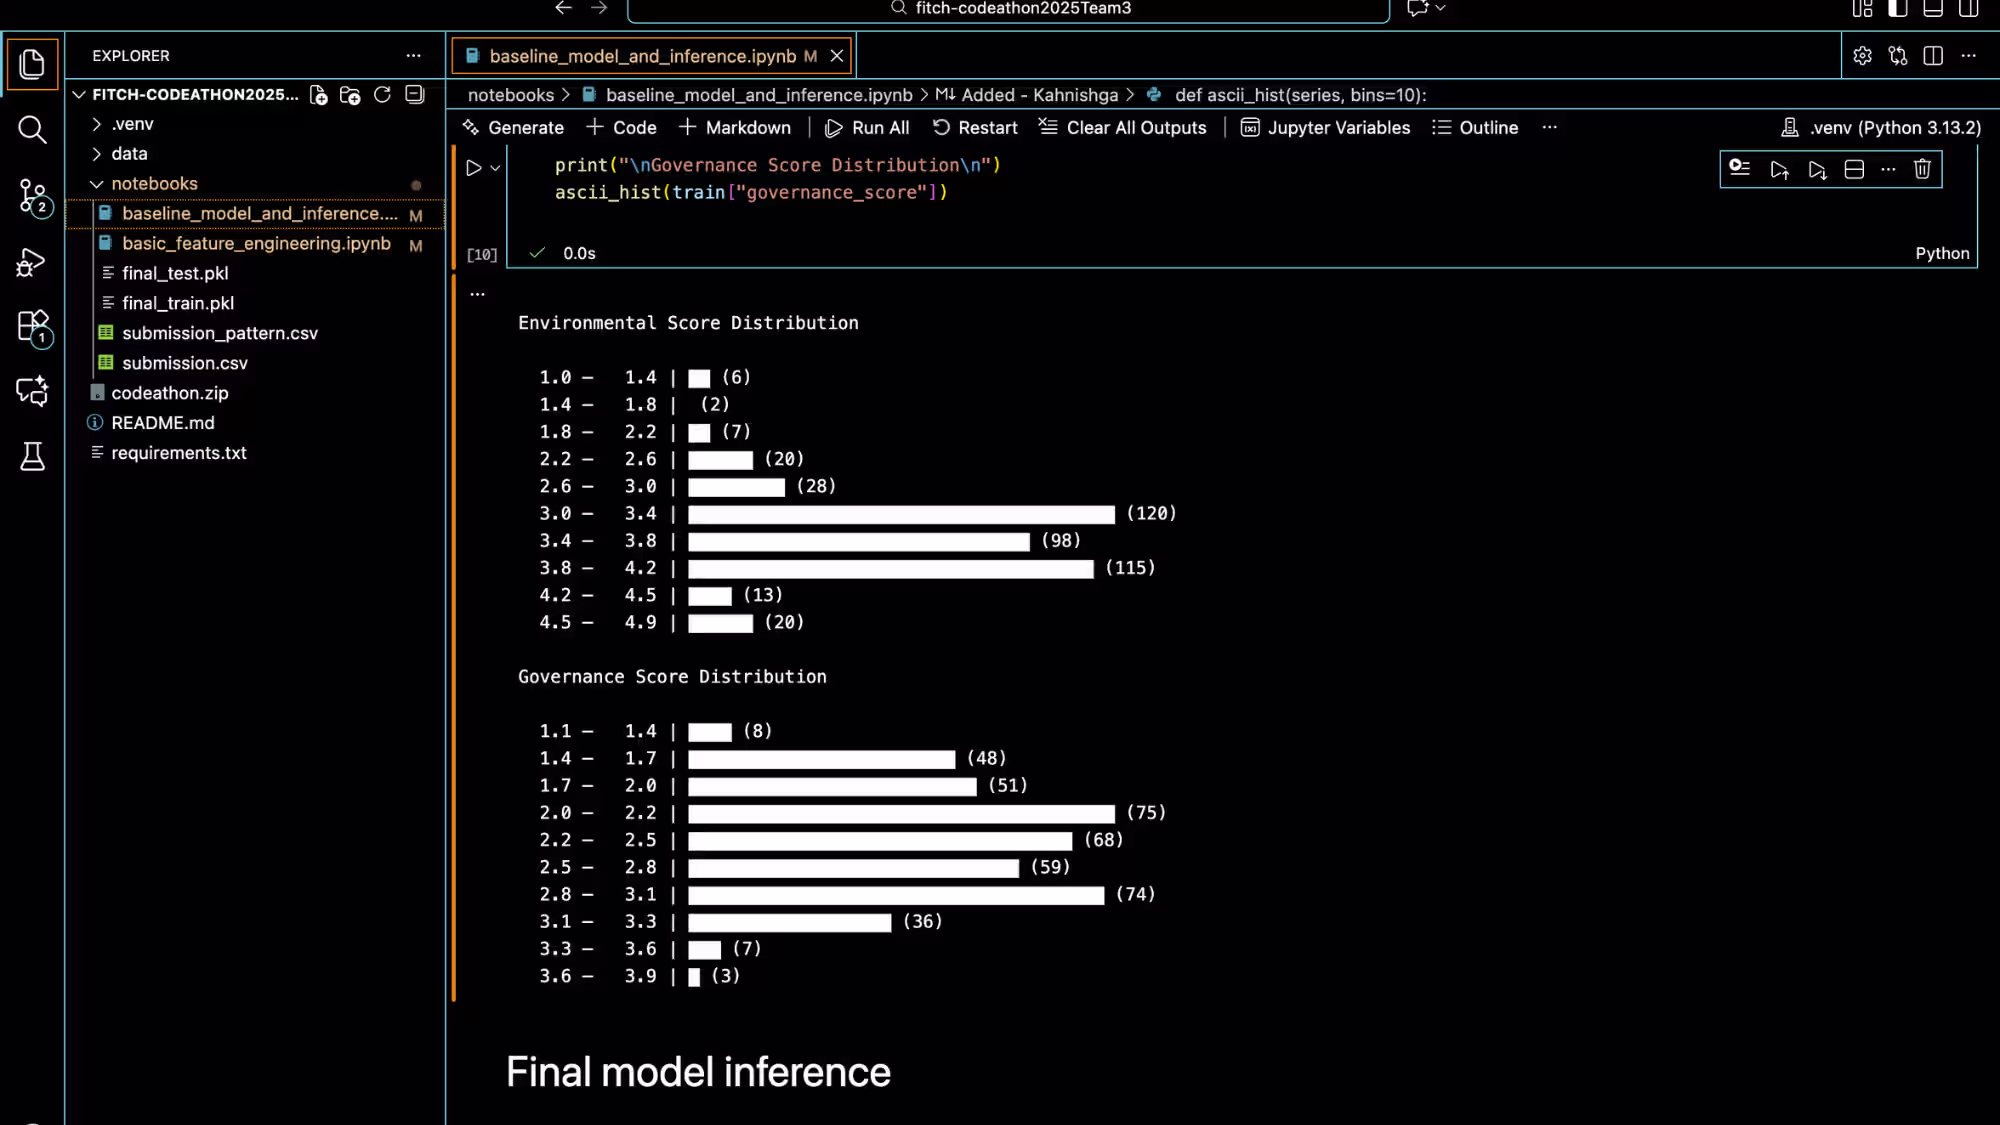
- Exploratory data analysis with histograms, scatter plots, and correlation heatmaps
- End-to-end data cleaning, feature selection, and model evaluation workflow
Technologies Used
- IDE: VSCode
- Python
- Jupyter Notebooks
- scikit-learn
- Pandas
- NumPy
- Matplotlib
- Git
Challenges & Learnings
Challenges:
One of the main challenges was handling heavily skewed revenue distributions and missing data across multiple features, which required careful preprocessing and feature engineering. We also experimented with more complex models such as XGBoost, but encountered stability and tuning challenges within the project timeline. Selecting the most informative variables and aligning model predictions with real-world emissions trends required extensive debugging and iteration.
What I Learned:
This project strengthened our understanding of real-world data challenges in ESG analytics, particularly the importance of feature engineering and data visualization when working with noisy, incomplete datasets. We gained hands-on experience building and evaluating regression pipelines, interpreting model outputs, and connecting technical performance to business and sustainability impact.